We accidentally made something super powerful
When building product at Webtrends Optimize, we operate very much on a 'fly by the seat of our pants' basis.
The product team talk to a lot of customers and prospects, stay close to what's happening in the world, and this allows us to make decisions quickly.
Without weeks in research and design, and rather un-fussily, we build on our product quickly and get things out into the wild at pace.
Sometimes, this just means delivering features and bugfixes exactly as planned, and with the intended consequence - all great, no problem.
Sometimes, however, we surprise even ourselves!
Our new Discovery reporting engine was originally earmarked to be called Dimensional Reporting, based on its most advanced feature of applying dimensions within the data set.
To our surprise however (the market doesn't seem ready for it yet!), this hasn't been the real attraction. Instead, we've found some surprising love for the behavioural filtering in Discovery.
How did we build filtering in Webtrends Optimize
When designing (and I use that term rather liberally) the filtering for the first phase of Discovery, I considered what data we had to hand that wouldn't require users to re-tag.
Naturally, this bought in the obvious things such as Device type, Browser, User Agent, IP address etc.
We also managed to get in geolocation, which bought Country and City into the mix. Still, nothing super special.
We did, however, also realise that we had conversion data to hand by nature of collecting and reporting on it.
And in this process, we decide to make Metrics Triggered as a filterable data point.
What is the Metrics Triggered filter?
As the name suggests, you get to apply an 'on-the-fly' filter, where you can take any metric that you've collected as part of your test, and filter in or out any users who've triggered it (or not).
There are a few obvious use cases for this:
- "I want to see users who have purchased"
- "I want to see users who haven't purchased"
- "I want to see users who haven't purchased, did get to the checkout, but also saw errors"
These are all very simple to set up in the product, as long as you're capturing the metrics (doesn't matter which name you chose):
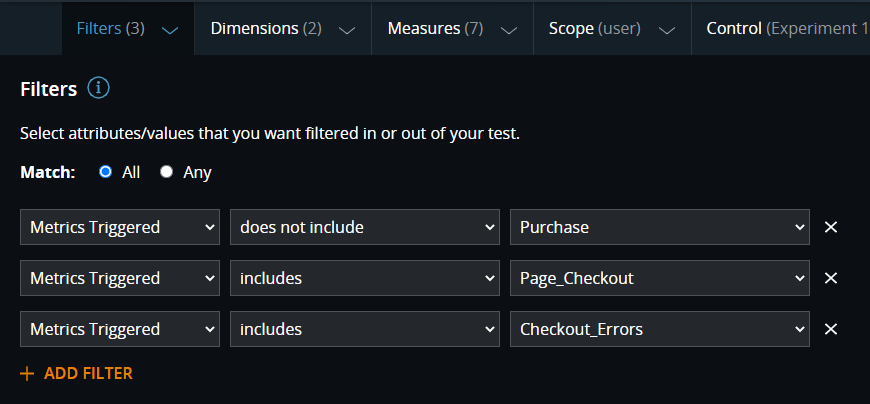
Pretty easy, right?
The real power of this feature though, is in the absolute freedom we created.
Hey Alexa, play Freedom by George Michael…
Analytics reporting has always in part been to build canned reports for users, and in part to answer questions that people come up with.
Canned reports aside, the freedom provided by the above, paired with our long-standing ability to capture a considerable number of metrics, has made the latter incredibly easy.
As one of our consultants (who's pretty experienced in experimentation platforms) recently put it to me "if someone asked me this in the past, it'd take 2 hours to extract the data, get it into excel, PowerBI or somewhere, work out how to model the data and then answer their question."
A huge difference it's then made, to look at Discovery where "In 10 seconds, I just click the filters to say 'show me users who clicked this and didn't do that' and that's it. The data is ready to answer their question."
TTQA
Let's coin a new acronym, to go along with Google Lighthouse's TTFB, TTFR/P, CLS…
TTQA: Time to Question Answered.
For this, this is an incredibly valuable metric. Let me explain why.
-
The first is to unlock an analyst's ability to… analyse.
Until Discovery, the platforms were always the bottleneck to analysis. Users would try (if their vendor allowed) to get their data into tools like PowerBI, Tableau, perhaps locally to parse with Python or R… but on the whole, the majority of users would use the tools they were given, and they were frankly slow and barely capable.
The net result of this is only being able to analyse so much - there will be some standard things you'll look at, but when your time to perform analysis is perhaps a day (or two, three), there are only so many questions you can get answered in this time.
On the other hand, I hear "because the effort has reduced, I'm more inclined to dig deeper. More able to because the answers are so quick."
-
The second is what this means for us on a long-term basis, for product progression.
If it's really that fast to get answers from the platform yourself, the natural next step is for us to do it for you.
The future is bright
The aforementioned 10 seconds is largely requests flowing through a network (going from your browser to our servers, to our database, through our stats engine and then back out to you, wherever you are in the world).
On our servers, however, the processing time is sub-second - counted in milliseconds for us.
So, when we make the natural next step to start calculating things for you and guiding you, it's going to be fast too.
Very fast. As in, save you a week of scratching your head, looking for insights that don't exist, fast!
Sounds fun, right? We're certainly looking forward to it.
If you'd like to see a demo of Discovery in action (or anything else for that matter) feel free to reach out to the team and we can get something set up for you.


