What is Discovery?
Discovery allows you to analyse experiments in more detail, observe data from different viewpoints (easily highlighting trends & exceptions) and discover intelligent insights faster than ever before by using Behavioural Filters & Dimensions directly in Webtrends Optimize, eliminating the scope for human error.
Key Features
Here is a quick exploration of just a few of Discovery's key features...
Re-order your dimensional data hierarchy
View data how you want it. Put the custom dimension as the category, group or row. No more opening multiple browser tabs or exporting data into spreadsheets to build custom views.
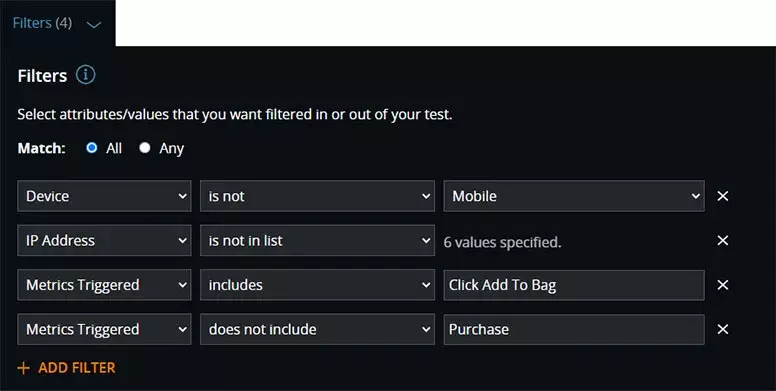
Virtually limitless filtering
Add as many as you want including device types, browsers (including niche tech such as Tesla in-car & Oculus VR), geolocation (city or country) etc.
Behavioural filters
Filter on any metric you've captured in your experiment eg. pages viewed, elements clicked, errors tracked, add to basket, purchases, AOV etc.
IP address filtering
Successful tests rely on clean data. Remove the contamination of non-genuine traffic and control the environment of your experiments.
Negative filters
Use any of these filters not just for inclusion, but for exclusion too.
Match any or all
Match your selected filters on any or all attributes.
Filter out rogue traffic
Exclude other 'known' traffic sources/channels that are not relevant or are skewing your test results.
Select scope
Analyse your conversion rates based on user lifecycle or session.
What problems does Discovery solve?
Discovery tackles two key challenges we've identified with how users analyse their experiments…
How does Discovery solve these issues?
The ability to report on tests by dimensions was, until recently, a feat limited to pure Analytics tools like GA and Adobe. If you wanted to do sophisticated analysis, you'd do it there... without the statistics to hand.
Whilst the ability to apply a dimension to slice your entire data set isn't new, the ability to decide exactly how you want to view the data is.
Essentially you get to ask completely different questions of your data, on the fly (without needing to pre-define), and have them answered by Discovery.
Sandeep Shah, Product Director at Webtrends Optimize sums it up best: "We've built something I've not seen in any experimentation tool to date - by nudging where the custom dimension is inserted, your view changes completely."
Combine this with an engine that provides some of the most sophisticated filtering seen in any testing tool on the market…
- Not only exclusion but inclusion too
- Not just a few canned segments, but hugely open-ended ones too
- Not only reporting by user, but by session if you want to as well
All things you can adjust ‘as you work’, and re-fetch with a single click.
From the studies we've done, this reduces analyses that can take a whole day to something you can achieve with a view in our Discovery UI in literal SECONDS.
No tiers. No paywalls. No upgrades required...
And the best thing about Discovery? It's built into the Webtrends Optimize platform and available as part of our full-stack, all-inclusive model.
And therefore, when you buy your licence, you get it as standard, at no extra cost, as always!
View Pricing