When we started this year, and put together our first long-term roadmap, our goals were made clear: Build the most capable reporting suite of all AB Testing tools.Other parts of the product matter of course, but this was the key place we felt we could get years ahead of the industry. The opportunities for doing this were clear, identified and added to our public roadmap. We'll discuss our progress through this journey here, along with other initiatives.
Working towards our roadmap
We are continuing to work through our goals and will continue to deliver against the roadmap in the direction of the features described throughout this article. Whilst there are still some areas we are yet to work on, we are confident in the roadmap and you should expect to see these features made available to you, as well as everything forecasted, this year. This is supported by having twice as many engineers as we started the year with, and a growth-plan to make sure the team continues in this direction.
Clarity of reporting on key metrics
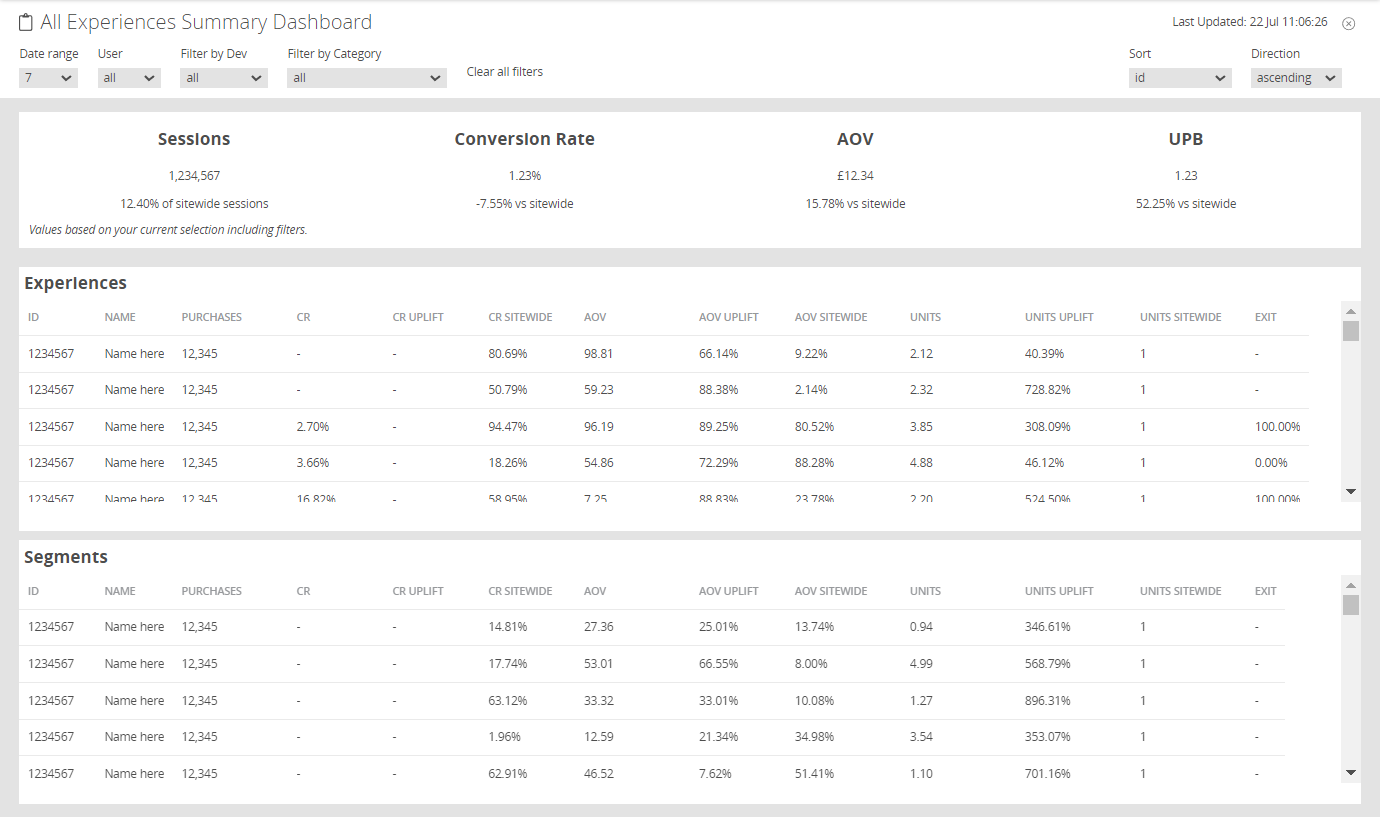
We now have the ability to report on a slew of metrics that are particularly relevant to ecommerce sites: Purchases, Units, New Customer Conversion Rate, Average Order Value, Average Item Value, Items per Basket, Average spend per user, Average spend per transaction, Session duration, Pages per session, etc. We have our first customer using this and will look to roll this out to everyone globally - the requirement being that we standardise our metric capture to enable this.
Ability to understand performance at a glance
It's painful to click into every test to understand how things are going. Alerts help with this, but when reporting on a programme it's far better to have all of the numbers to hand. This dashboard, first released mid-June to our first customer with a similar rollout plan to the above, looks to provide this information to users behind one click. And we feel is a great step ahead for time efficiencies.
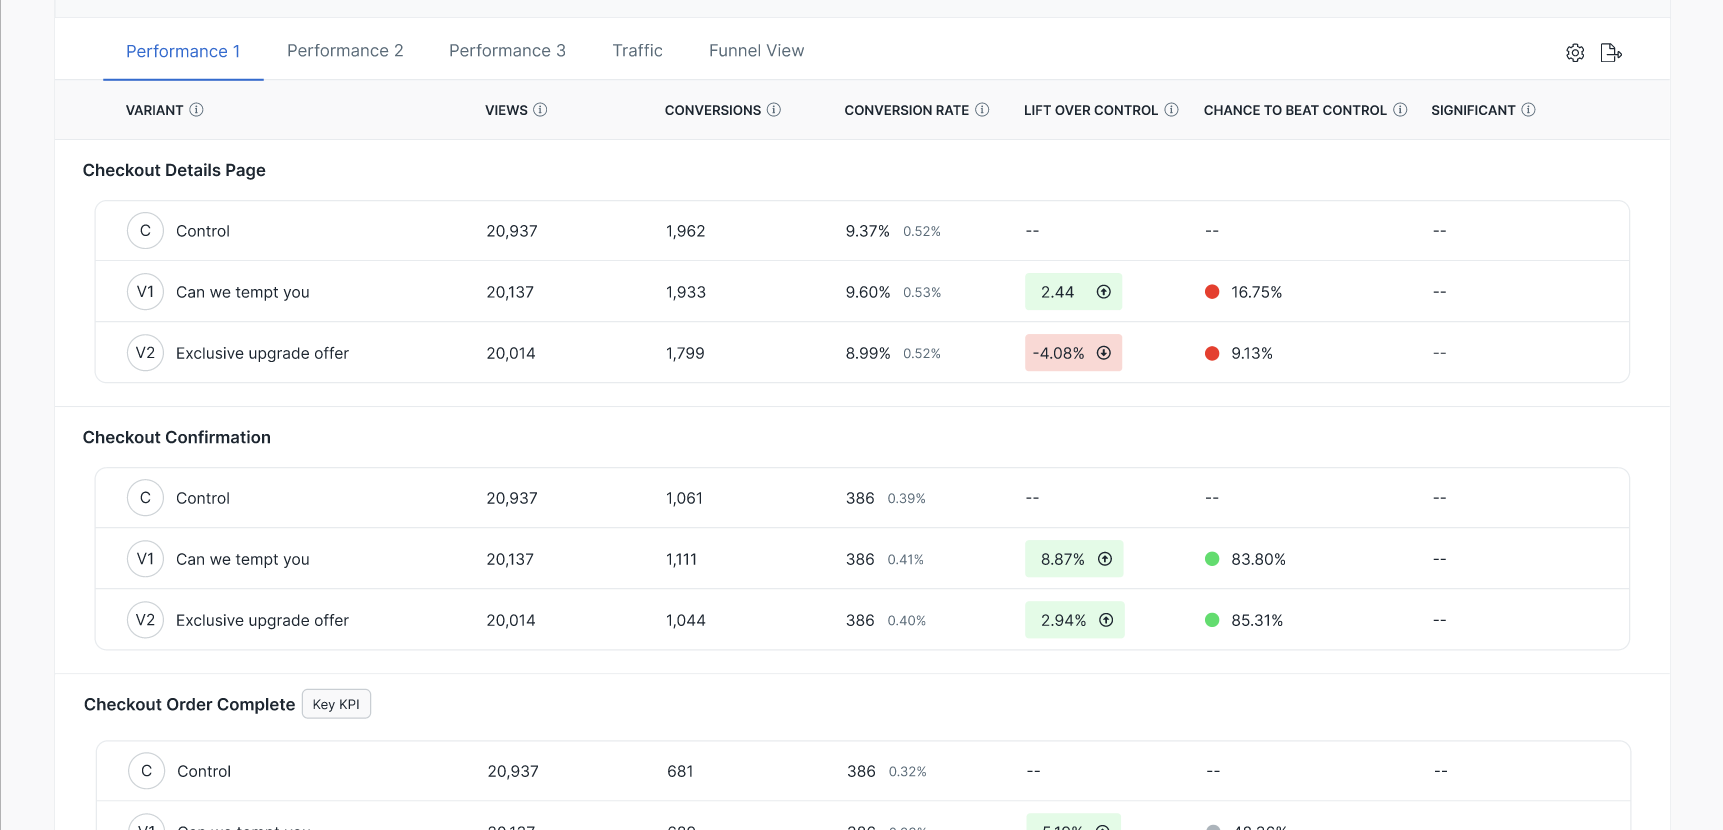
Automated Insights
When we launched our Discovery reporting suite, there was a clear path. First, make the reports flexible and fast enough that you can get advanced insights quickly. We achieved this, with most reports including adhoc filtered queries loading sub-second with zero sampling. Next, was this goal of Automated Insights. The first phase of this is now built and pending QA. This will scan subsegments of your test and look for deviations from the mean; both positive (that should be analysed to spread learnings) and negative (to check and defend against). As we look to produce high-quality presentation-style outputs from this data in one click, you'll find many hours saved per experiment, and insights uncovered that you'd never have found yourself.
Reporting for personalisation and other features
Not being able to visualise the data we hold makes wanting to get use of these features difficult, as well as then seeing value from them. Starting with a Social Proofing explorer interface, this work has begun, entering development. Our hope is that with more screens to see your data, you'll be able to problem-solve better, and have a better idea of "the art of the possible" to then sell this into the people you work with.
Looking at our other big initiatives
Alongside our roadmap which we are continuing to work towards, other big initiatives that we see as a key part of our offering are also in progress. These initiatives will add value and enrich the experience of our partners and clients alike.
Certification & Support
We want to make users of our platform some of the brightest in the industry, to match how advanced the platform can be. We have built the first course for Developers and looking next at Analysts. We are making these tough, relevant, and to teach you the skills to be great at the job regardless of the platform you use.
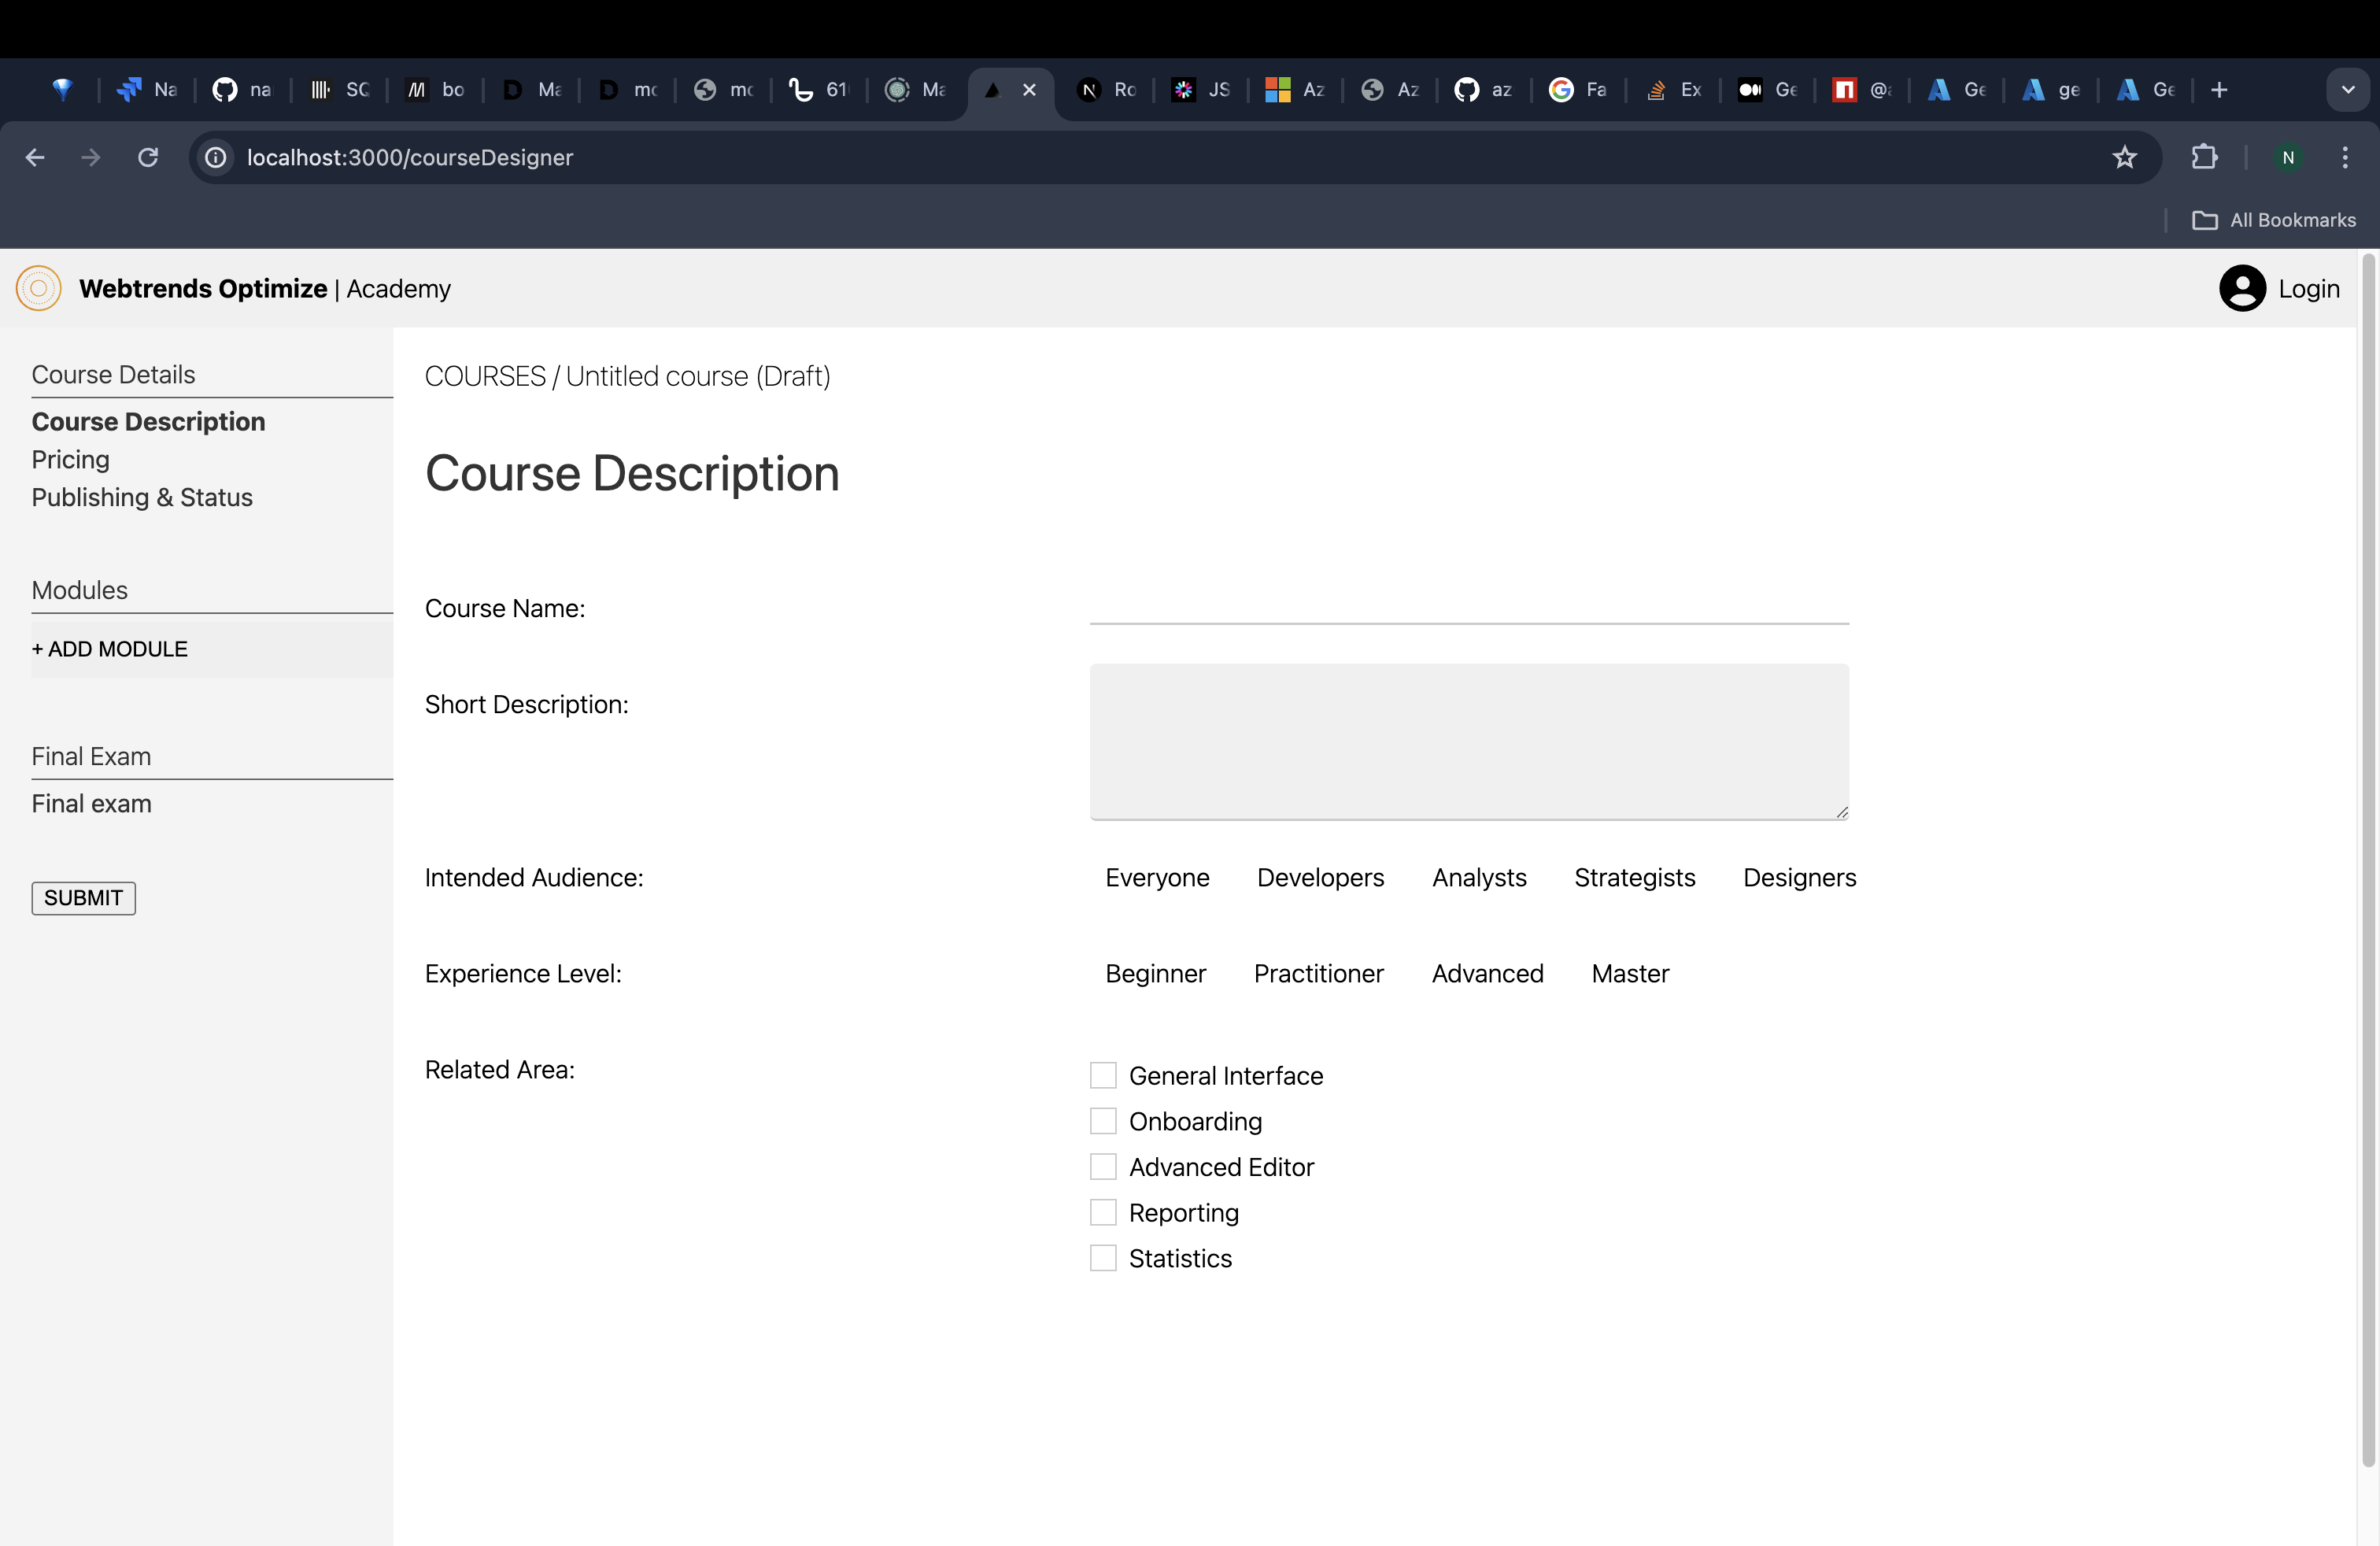
About a dozen people have been certified through the first course, feedback has been noted, and a web app is being built. This will allow both us and also the public to build and host educational courses with us, and to spread great knowledge to our users. We expect a polished version to be ready around Q3 of 2024.
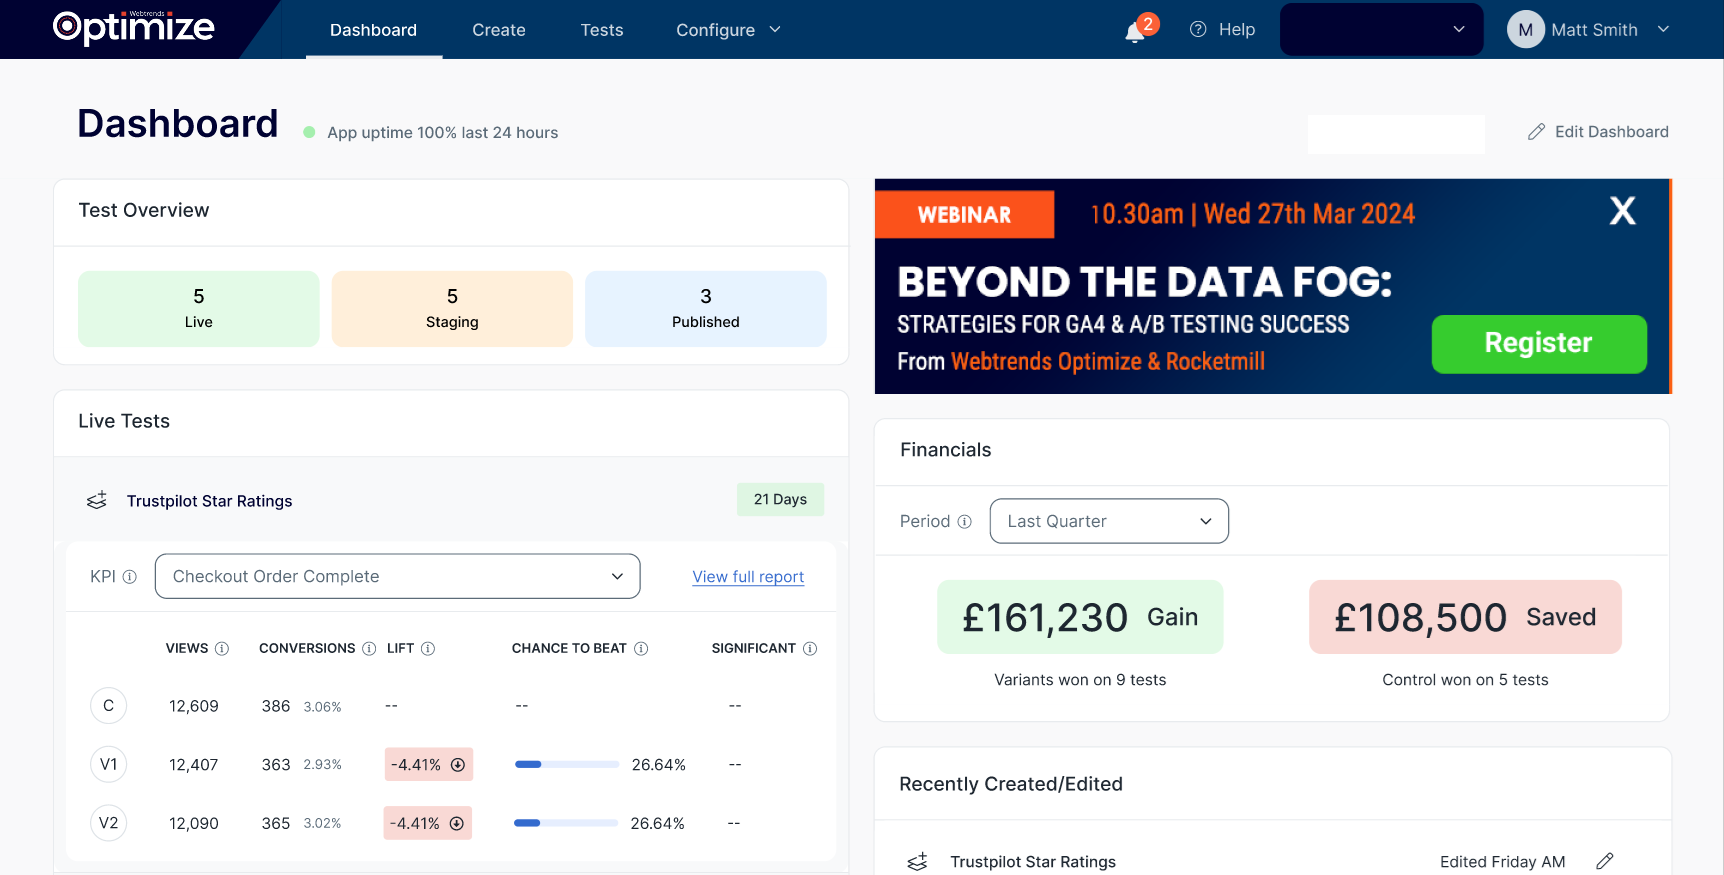
Redesign / New Interface
We've had, and acknowledged, feedback that our interface appears too advanced, and could be both easier to navigate and more useful to our users. We react quickly to feedback, which hopefully our clients and partners recognise, and have embraced a customer-led project. Over the past few weeks, some of our customers and partners have been contributing to the flows and designs of our new interface. This journey begins with login and the initial dashboards screens.
The new login is built, pending QA. The dashboard designs are almost complete, and so these will enter dev in the coming couple of weeks. Throughout the year, you will see brand new screens materialise in the UI that better represent us, and better serve our customers.
Other bits
We're spending considerable time bug-fixing for stability, modernising our infrastructure, improving our tags, integrating with more platforms, etc. - key parts of how you use us will continue to evolve too, and whilst reporting is an area we can fly far ahead of others, the rest of the UI and product will continue to evolve too.
Acceleration of our product offering
I believe that what you've seen from us over the past 5 years, and what you'll see through the coming 12 months is an incredible acceleration of our product offering - focused on testing. This contrasts with what we hear of other platforms, with split focus and slow delivery. We hope that customers being increasingly involved in our process is felt as positively as we receive the feedback, and through education we can all continue to raise the bar.
