How do I know when to stop my test? How long should my test run for? What factors should I be considering when I am looking to stop my test?…
These are questions we often hear from our clients. Sometimes in conversion rate optimisation the answer is straightforward… Your test has reached statistical significance and either your hypothesis has been proven right or wrong, so you can stop the project and walk away with the results.
There are also times, when you need to take into account all background information around the project to arrive at a conclusion. This post will focus on key questions that may help you to make an informed decision as to when to switch off your test.
1. Is there a minimum and maximum test duration?
This is dependent on many factors such as:
Test and Sample size
If you are running an ABn or an MVT test with many experiments, then naturally this will take longer to capture more data and conclude. This can also be the same for an AB test. If the sample size, aka traffic to your page or site is low then data will take longer to collect.
Test Variant, and Main KPI Conversion Rate
If you are making an obvious change for customers such as a banner change or adding in new functionality then the change will be easier for customers to see. Therefore their preference of continuing or not will be quicker to see within your results.
If you are testing a small copy change on an area of your web page that not many people click on, this doesn’t necessarily mean that due to your change customers will instantly start reacting to it. This could also make your testing period longer. Due to a) not many people will maybe notice your change, so will have no opinion to like/dislike of it, and b) the conversion rate is minimal and is unlikely to see a big change.
Marketing Activity and Seasonality
In addition, this can also depend on other external influences such as marketing campaigns, changes in traffic from mid-week to weekends etc.
Seasonality or force majeure events that may also influence consumer behaviour.
For example, you may notice demand for certain products such as air conditioning units increasing during heatwaves. Or people are adding more extras to their home insurance during extreme weather. Or take a situation in the travel industry – with COVID-19 and global lockdowns, customer behaviour became erratic.
It is important to be aware that correlation does not imply causation and external event may or may not cause certain customer behaviours. However, as you become more and more experienced in conversion rate optimisation, you may start to see certain customer behaviour reoccurring across various projects and you gain deeper insights about your customers, your business and your brand.
Therefore, we typically say a minimum of 2 weeks is preferable. This is so you can compare one full week to another and see if a trend is becoming apparent. In case of any force majeure or external events happening, the test may need to run for longer. This is in order to identify the mean conversion values over a longer period.
2. How do I know if my test is statistically significant?
When you calculate statistical significance you are making sure that a difference in conversion rates is not purely by chance. And the difference from the control is meaningful and not random.
Within the Webtrends Optimize platform we try to make this as easy as possible to understand for positive and negative direction. We have a column within our reports which states if your results are significant or not.

The default confidence level is set to 95%, meaning the chance of a false positive is limited. However depending on attitudes to risk, there is freedom to adjust this higher or lower. If a test is not ‘significant’ at the 95% level but at 90% this may still be considered acceptable and actionable.

3. Is Chance to Beat Control as important as Statistical Significance?
Ideally you should use Chance to Beat Control and Statistical significance together.
For a given metric, Chance to Beat Control gives a probability and therefore guidance on the likelihood of an experiment outperforming the control. The chance to beat control statistic has no information about whether or not the “chance” is repeatable and/or consistent.
Statistical Significance provides you with whether the observations being compared are meaningful or possibly down to chance.
Are the Results Positive or Negative?
Chance to Beat Control will be able to give you an indication of your test outperforming or underperforming the control.
As a general rule, an experiment with over 90% Chance to Beat Control or higher gives a strong indication that this experiment is the winning one. Vice versa, a chance to beat Control lower than 10% indicates a negative dynamic for the experiment.
Therefore Control will be considered as an Optimal. However, both are only relevant if you have a large enough conversion difference from experiment 1 and experiment 2. A conversion difference of 10 is not very big, however a conversion difference of 100 is a much larger difference. This is a good sign your experiment is achieving better results for more people).
In some cases when the traffic to the site is limited or the differences between the experiments are more subtle you may need to rely on Chance to Beat Control more so than on Statistical Significance.
Smaller incremental changes achieved through projects with high Chance to Beat Control will result in cumulative positive effect and increased conversions across your site.
4. Do I need a certain number of visitors and conversions before I can stop the test?
Traffic / Sample Size
You probably have experienced the following situation when the traffic to the test page is low. Or traffic is low at the beginning of your test. Then after a few days one of the variants is performing exceptionally well. It is even showing a statistically significant result. However, there is a caveat. The number of conversions is low and you cannot base your results on this data.
Whilst there are algorithms and formulas that can help you determine a number of conversions needed to reach Statistical Significance; we would not advocate citing the exact number of conversions you need in each test.
Each business, website and project has to be considered in a larger context. First of all, as been mentioned above it depends on your sample size, your conversion rates, the strength of your experiments…
The lower control conversion rates, and the more radical changes you are looking to implement, the more likely you are to reach high probability rates and Statistical Significance earlier.
Trends and Patterns
On the other hand, we have worked with many clients who have relatively high conversion rates in their funnels and there are objective limitations with regards to how radical changes you can test.
For example, banking, insurance companies or government organisations are more cautious and risk-averse in their testing approach. In this case, the difference in conversions between the experiments is not high enough to reach Statistical Significance.
But using Chance to Beat Control, running a test over a period of several weeks and taking into account seasonal and weekly changes in conversion patterns becomes even more important.
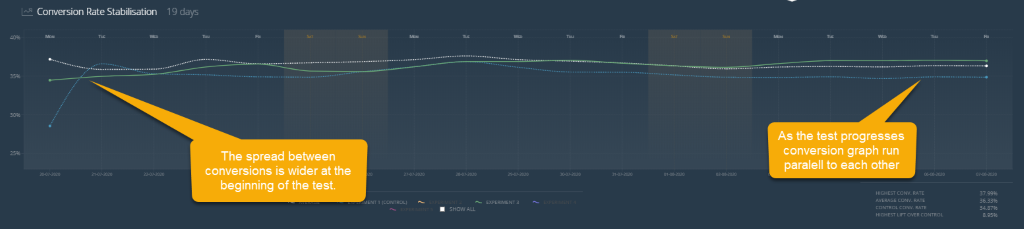
5. How can I use the Stabilisation chart to understand to determine when to end the test?
Another tool that can help you to determine the test maturity stage is a conversion rate stabilisation chart.
It is a time series that displays your key conversions and makes it easier to compare your experiments conversion rates with averages and control. At the beginning of a test conversion rate values have a larger spread and that is reflected in the chart.
As the test progresses and more and more conversion values are gathered, each experiment converge towards its true mean value. This behaviour is what is called Regression to the Mean rule in statistics.
The rule states that as with any series with complex phenomena that are dependent on many variables, where chance is involved, extreme outcomes tend to be followed by more moderate ones.
When it comes to conversion rate optimisation, as the sample size of the test gets larger, the values we are measuring get closer to the mean. This is a very useful chart to use when your site or page you are testing does not have either big traffic or the difference in conversions between two experiments does not allow the test to reach Statistical Significance.
It is a great idea to refer to the stabilisation chart and observe how each experiment is performing. As you can see from our example below experiment 3 was outperforming the Control for the most part of the test.
Conclusion
In conversion rate optimisation we have a robust statistical methodology to guide us through planning, running and evaluating our projects.
We need to be aware of numerous biases when running our tests. The stats do help us to be as objective as possible when evaluating the results. It does not mean that we can eliminate the subjective element from conversion rate optimisation altogether.
However, there is one very important thing that the experience of working with data taught us. The larger the body of knowledge the company or agency have, the better understanding of customer behaviour they can offer.
By analysing data, comparing with previous projects, drawing parallels with tests done by other companies, we can minimise the bias and also make stakeholders aware where the limitations are.
That is why working with experienced consultants and a team of professionals help to make balanced decision and come up with solid hypothesis for testing.
If you would like to have a chat with us about your conversion optimisation programme, please feel free to get in touch for a no obligation, informal conversation about we might be able to help – with either/both our technology and/or our team of CRO experts.


